Livewire Live – content round-up
On 9 September 2025, some of Australia’s most experienced professional investors assembled to debate critical …
We want to ensure you get the right experience for you.
Discover the Allan Gray difference. Learn more about our Funds including performance and download offer documents.
The information contained in this section is for adviser and wholesale investor use only.
The Allan Gray Australia Funds are available for investment by New Zealand retail clients.
To comply with New Zealand law, our website provides information only about Allan Gray Australia Funds. We do not provide advice to New Zealand retail clients.
You are about to enter Allan Gray Australia.
If you are looking for Allan Gray South Africa, please click here.
US persons are not generally permitted to invest in the Allan Gray Australia Funds. However, we will accept applications from US persons who are genuine residents of Australia, New Zealand or South Africa.
 It is unclear if we are on the cusp of a deep or protracted cyclical downturn. What is clearer though, is that if a recession is imminent, it is likely to be one of the world’s most telegraphed recessions yet.
Share markets are forward looking so we consider that these expectations have already been factored into share prices, at least to some degree.
This is an extract from our June 2023 Quarterly Commentary and you can read the full Quarterly Commentary here.
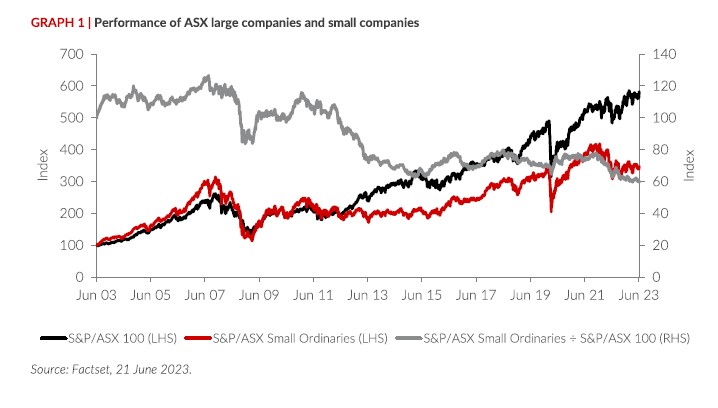
Over recent months, equity investors have gravitated to the perceived safety of large companies at the expense of ‘riskier’ smaller companies. Graph 1 illustrates this. It plots the performance of the S&P/ASX 100 Index (the largest 100 companies listed in Australia) and the S&P/ASX Small Ordinaries Index (the next 200 largest companies listed in Australia). The Small Ordinaries Index is now at its lowest point relative to the ASX 100 Index since April 2000 when the Small Ordinaries Index first launched.
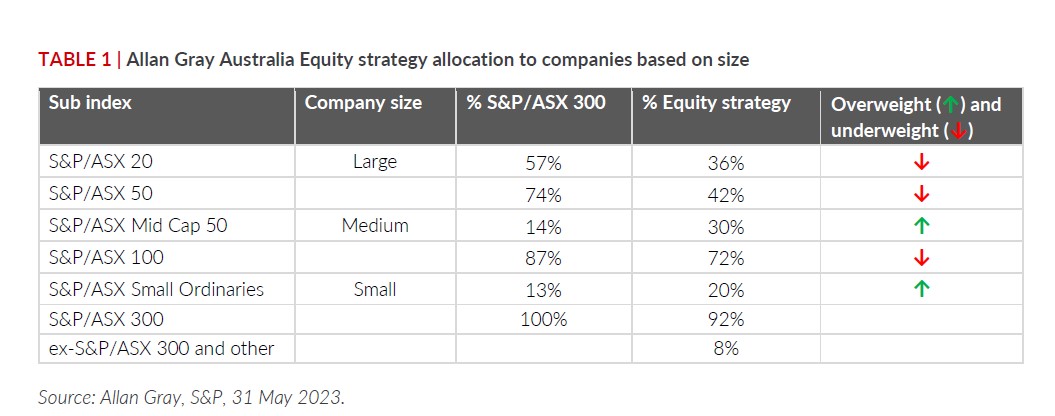
While the Allan Gray Australia Equity strategy does own some large companies, it has a significant skew towards medium-sized and smaller companies (see Table 1). It is here that we think the greatest upside potential exists. Lendlease is one such medium sized company. If it’s true that good investments often begin with an element of discomfort, then Lendlease would fit the bill.
Lendlease’s share price performance has been woeful and makes the performance of the Small Ordinaries Index look like that of an artificial intelligence chip designer. Analyst, Tim Morrison, discusses our Lendlease discomfort below.
Lendlease is best described as a global real estate company with vertically integrated operations across development, investments, and construction:
Each of these segments is described further below.
In its development business, Lendlease has $5.9 billion of invested capital, which funds projects at various stages of completion. The development business first secures a site and planning approval, only typically entering a fixed-price construction contract once it deems there to be sufficient presales (apartment deposits) or pre-leasing commitments from major tenants (offices) in place. Lendlease’s development business employs either an external construction firm or Lendlease’s own construction business to build its development projects.
Most of the development projects are in major global city centres. It has $18 billion of work in progress today, a $121 billion long-term pipeline and ambitions to complete $8 billion of new projects annually.
More than half of Lendlease’s $121 billion pipeline is ‘land management’ deals, which should reduce Lendlease’s development downside (and upside) as the land cost for Lendlease is assessed towards the end of the project, generally subject to a priority minimum return for Lendlease.
Graph 2 details the split in Lendlease’s development work in progress and pipeline. Lendlease’s management expects the development business to make a 10-13% return on invested capital through the economic cycle.
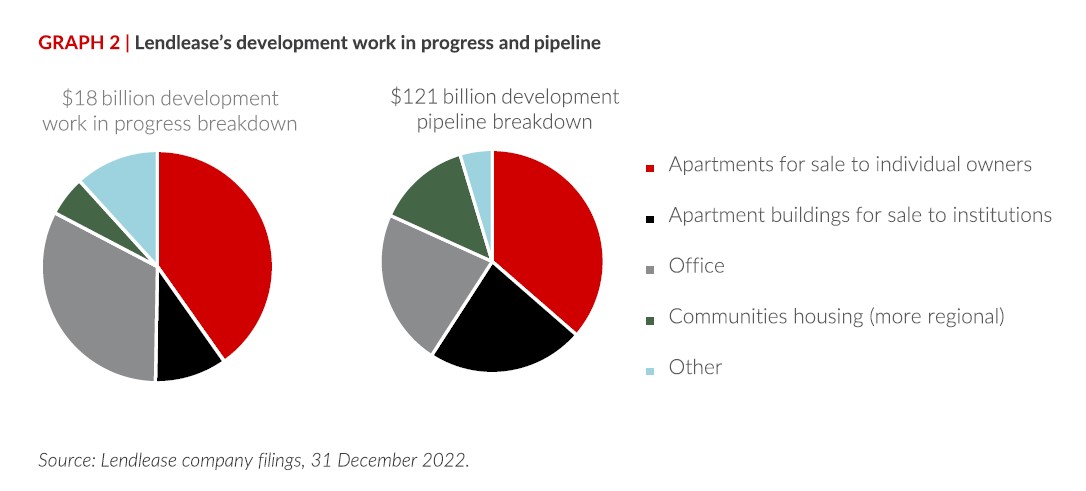
The investments segment manages $40 billion of real estate investments as well as property asset level operations such as leasing. Fees are at least 0.75% p.a. of market values on which Lendlease earns at least a 35% pre-tax operating profit margin.
Lendlease itself owns $4.2 billion of equity, largely within the $40 billion of assets it manages and so also earns an investment return (rental income plus movements in market values) on this co-investment. Lendlease targets a return on invested capital of 6–9% for its investments business.
Graph 3 shows the split of Lendlease’s assets under management and owned investments.
Construction is predominantly an Australian and United States based business. It has annual external client (non-Lendlease development related) revenue of about $7 billion currently and it targets a low 1.5-2.5% pre-tax operating profit margin. Through a mix of employees and third-party subcontractors, this segment builds social infrastructure (hospitals, train stations, museums), defence facilities (airfields and other military bases) and commercial property for Government (60%) and external corporate clients (40%).
Managed correctly, Lendlease’s business segments together represent a self-reinforcing ecosystem. A significant portion of Lendlease’s development pipeline could potentially flow into Lendlease’s assets under management upon completion. Having an internal construction capability should assist Lendlease’s development business in negotiating reasonable contracts with external construction companies.
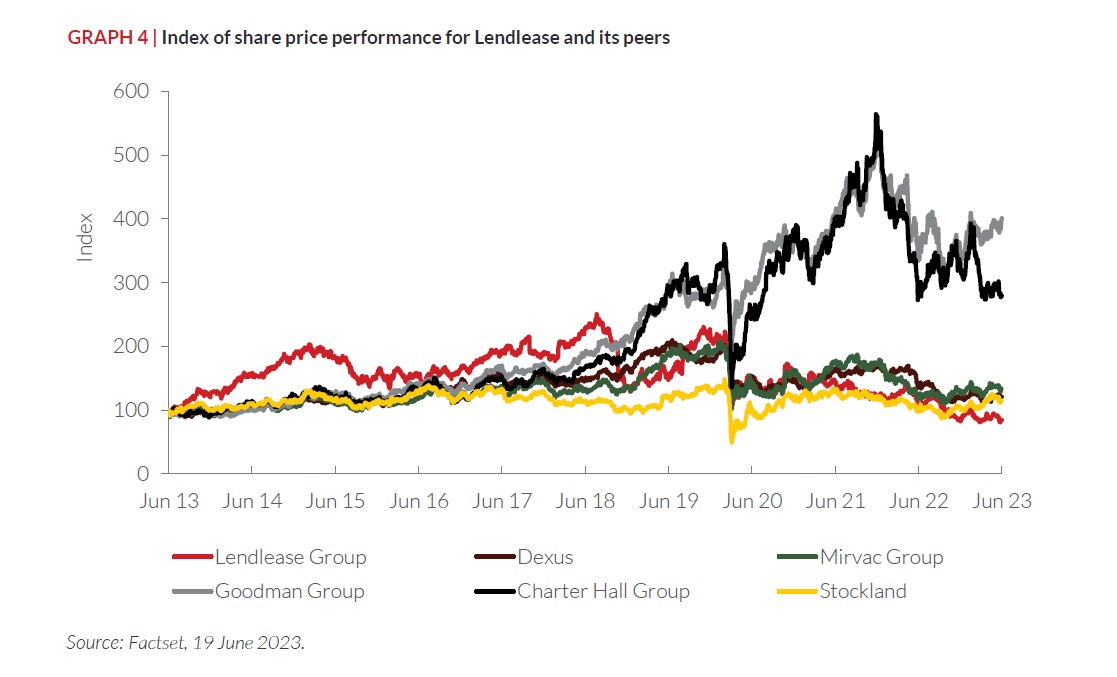
Returns to Lendlease’s shareholders have been spectacularly poor. Over the past 10 years, Lendlease’s share price has gone backwards — worse than most companies in the index. Most of Lendlease’s underperformance has come in the past five years.
There are several reasons for Lendlease’s woes:
The above is a long rap sheet of negatives but we believe there is cause for some optimism:
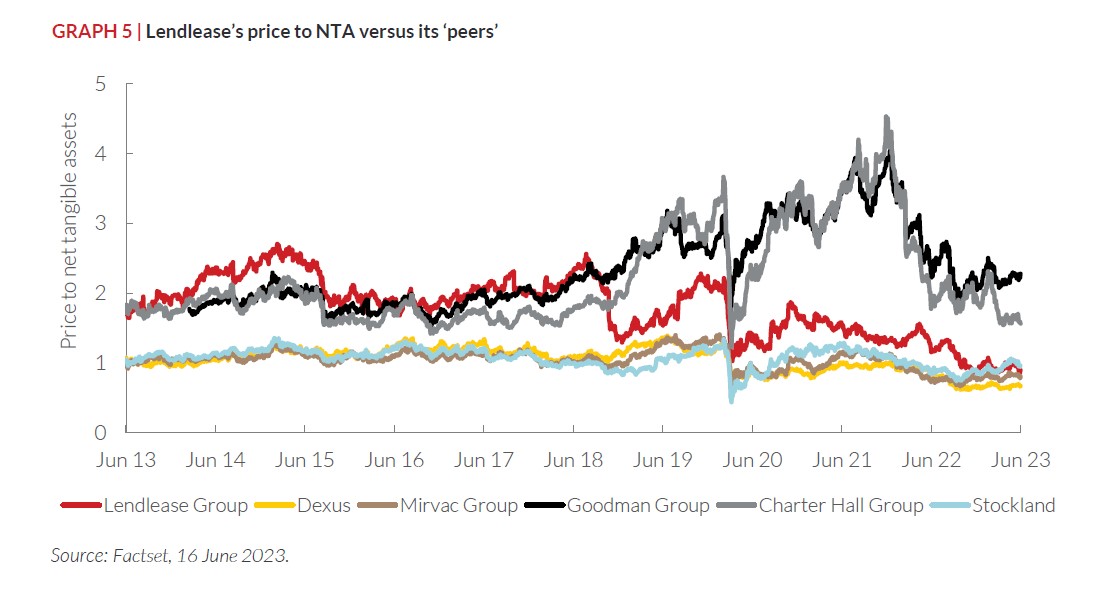
By far the biggest cause for optimism, though, is Lendlease’s share price. At $7.75 per share as of June 30th, Lendlease is trading at a slight discount to its net tangible assets (NTA).
This might look expensive relative to REITs like Dexus and Mirvac (refer to Graph 5), but these comparisons are misguided. REITs reflect nearly their entire invested capital bases at market value that, until very recently, have increased significantly. A significant proportion of Lendlease’s balance sheet is effectively carried at cost (or net realisable value if lower than cost). Also, its business is more skewed towards higher-returning development and fund management earnings than the REITs,
and so it is arguably more like Goodman Group and Charter Hall, which both trade at significant premiums to their NTA.
Lendlease is targeting an after-tax return on equity of 8-10% or approximately $600 million in profit. While these return assumptions are not heroic, they have also not been achieved in a long while. At its current price ($7.75), investors are paying nine times these targeted earnings. To be on the same earnings multiple as the broader share market, Lendlease only needs to deliver a 5% return on equity, compared to its target of 8-10%.
We believe there could be significant upside if Lendlease management is able to deliver on its targets and, in our opinion, relatively more modest downside if it doesn’t.
Equity Trustees Limited ABN 46 004 031 298, AFSL No. 240975 is the responsible entity and issuer of units in the Allan Gray Australia Equity Fund ARSN 117 746 666, Allan Gray Australia Balanced Fund ARSN 615 145 974, and Allan Gray Australia Stable Fund ARSN 149 681 774 (Allan Gray Funds). Equity Trustees is a subsidiary of EQT Holdings Limited (ABN 22 607 797 615), a publicly listed company on the Australian Securities Exchange (ASX: EQT). Allan Gray Australia Pty Limited ABN 48 112 316 168, AFSL No. 298487 is the investment manager of the Allan Gray Funds. Neither Allan Gray Australia Pty Limited, Equity Trustees Limited nor any of their related parties, their employees or directors, provide any warranty of accuracy or reliability in relation to such information or accepts any liability to any person who relies on it.
Past performance is not a reliable indicator of future performance. There are risks involved with investing and the value of your investments may fall as well as rise. This represents Allan Gray Australia Pty Limited’s views at a point in time and may provide reasoning or rationale on why we bought or sold a particular security for the Allan Gray Funds or our clients. We may take the opposite view/position from that stated, as our view may change. This insight is not an offer or recommendation, constitutes general advice or information only and not personal financial product, tax, legal, or investment advice. It does not take into account the specific investment objectives, financial situation or individual needs of any particular person and may not be appropriate for you. We have tried to ensure that the information here is accurate in all material respects, but cannot guarantee that it is.
You should consider the relevant Product Disclosure Statement (PDS) before acquiring, holding or disposing of units in an Allan Gray Fund. The PDSs, Target Market Determinations (TMDs) and Minimum Disclosure Documents for South African investors (MDDs) can be obtained from our Forms & Documents page. Each TMD sets out who an investment in the relevant Allan Gray or Orbis Funds might be appropriate for and the circumstances that trigger a review of the TMD.
Managed investment schemes are generally medium to long-term investments. They are traded at prevailing prices and the value of units may go down as well as up. There are risks with investing the Fund and there is no guarantee of repayment of capital or return on your investment. Subject to relevant disclosure documents, managed investments can engage in borrowing and securities lending. A schedule of fees and charges is available in the PDS.